SSTs - Info for Instructors
This page covers how instructors can access and navigate Student Survey of Teaching results, monitor response rates, and export or share data.
Accessing & Using Results
A given term's SST results will be released to instructors in the Qualtrics dashboard following the term's grade submission deadline. Refer to the Registrar's academic calendar for the specific date.
The Student Surveys of Teaching (SST) dashboard for instructors is administered in Qualtrics. There are two ways to access it:
Option 1: Direct Link (only works for instructors who have been provisioned access)
Use this direct link: https://kusurvey.yul1.qualtrics.com/reporting-dashboard/web/61505c925dd70300175de61c/pages/Page_30d38527-5dee-4e42-b62f-7745e6ff6a49/view
Option 2: Through Your Qualtrics Account (must have an existing account)
- Go to http://survey.ku.edu and log in with your KU Single Sign On credentials.
- If you already have an account, you’ll land on your Qualtrics home screen.
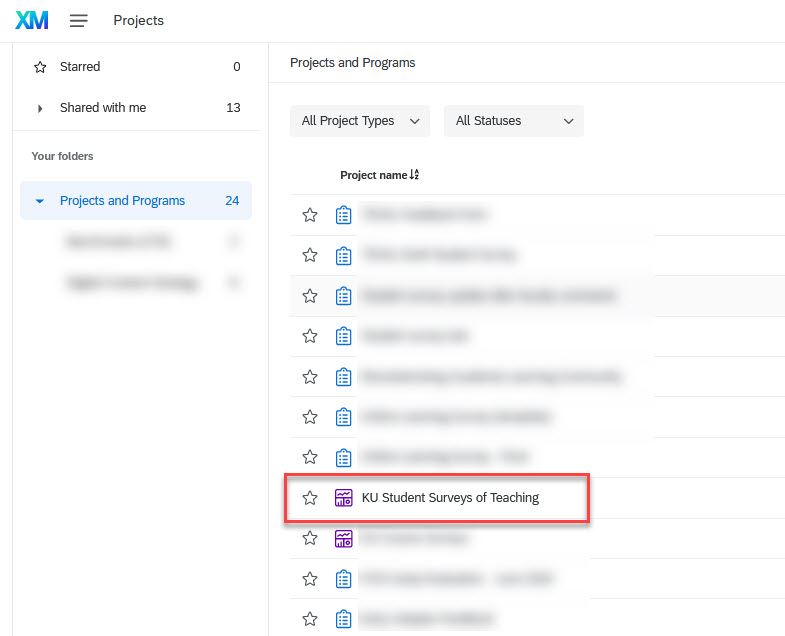
- Once logged in, find the project “KU Student Surveys of Teaching” under Projects and Programs and click to open the dashboard.
Note: If prompted, select “No, I don’t have a preexisting account here” — an account will be created automatically.
If you cannot access the Instructor Dashboard using the direct link or by navigating through your Qualtrics account, contact AIRE at aire-help@ku.edufor support.
The dashboard includes three pages:
- Surveys: The SST results for your courses
- Response Rates: Real-time response rates (visible after the first survey submission)
- Trend Report: Term-by-term comparison of each survey question result.
Starting Spring 2026:
A new set of these three tabs reflects data from the updated SST instrument. Previous data remains under tabs labeled “Archive.”
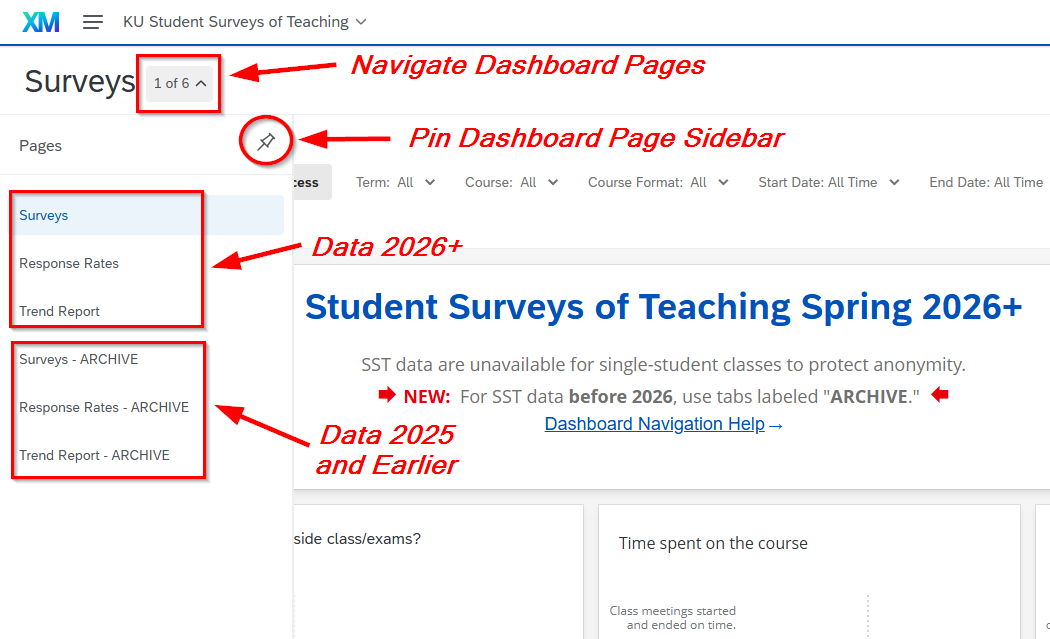
By default, feedback pages display all available data for all previous terms. Use the "Term" filter at the top of the page to narrow by term(s) or use the "Course" filter to select specific courses.
Tracking Response Rates
- Real-time response rates appear on the Response Rates tab, but only after the first survey for a course is submitted.
- Check your response rates anytime during the survey period: Click here for your response rates page.
- For survey distribution timing, see the SST Distribution Schedule
Improving Response Rates
Low response rates are a challenge we can address together. Here are steps you can take:
- Direct students to the survey link:
- In their KU email (subject: Student Surveys of Teaching)
- In Canvas under Account → Course Evaluations
- Note: Instructors cannot embed SST survey links directly in their Canvas courses. The links above are the only official access points for students.
- For In-Person Classes:
- Announce that you’ll reserve time in an upcoming class for students to complete the survey and leave the room during that time.
- Recognize that some students may not have a device; ask them to email you in advance for alternatives.
- For Online Classes:
- Include reminders in videos, assignment lists, announcements, and other communications.
The Center for Teaching Excellence has created resources for interpreting and using survey results for reflection and evaluation. The CTE site also has materials for incorporating the results into a broader framework for evaluating teaching.
Evaluating Teaching | Center for Teaching Excellence (ku.edu)
You can download SST dashboard pages in multiple formats or share your dashboard via email. Below is an overview of available formats and instructions for exporting results.
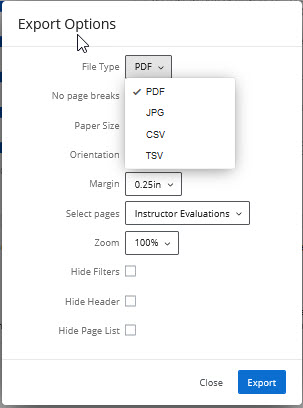
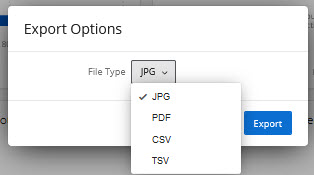
Download Formats
- PDF and JPG: Automatically expand all comment boxes so all available comments are included in the file.
- CSV: Opens in Excel and includes all results from the selected dashboard page, based on applied filters.
Starting Spring 2026:
Exports from the new dashboard tab set will include data from the updated SST instrument. Historical tabs remain available for pre-Spring 2026 data.
For full documentation, visit the Qualtrics website.
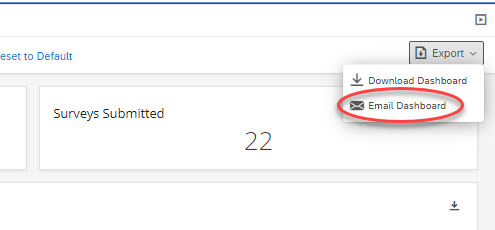
Download Dashboard
Click the Export button in the top right corner of the dashboard to download entire pages in your preferred format.
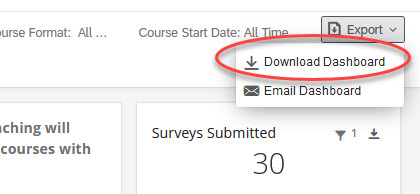
Alternatively, you can export individual dashboard widgets with the export button in the top right of each widget.
Email Dashboard
Email Dashboard allows you to email static versions of your dashboards to individuals with or without a Qualtrics account. These emails contain the version of your dashboard at the time the email sends. Click the Export button in the top right, and select Email Dashboard.
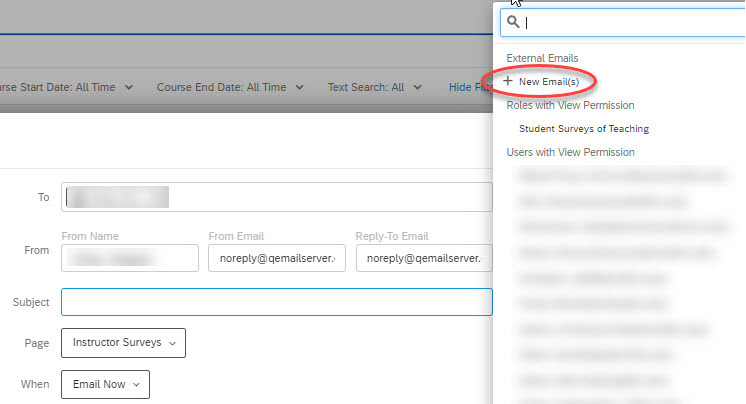
Choose who to send this email to. If you click the To field, you can choose from a list of users or Roles who have access to the dashboard, or select New Email(s) to add other email addresses to send to.
Attention: When a dashboard is emailed to an existing user or role, the dashboard data will reflect the permissions of the recipient. When a dashboard is emailed to a new email without access to the dashboard, the dashboard data will reflect the permissions of the sender.
Enter a desired Subject and optional message.
Determine if you want to Attach report and include a PDF of the page (or other file format), or if you want to just Include widgets in email body, which will include the widgets as JPG images in the body.
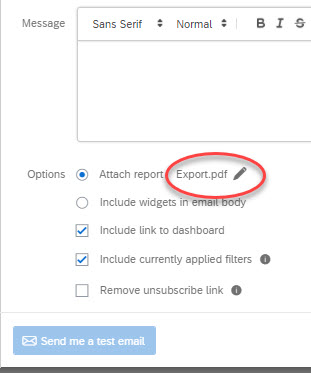
If Include currently applied filters is selected, the filters you are adjusting in the dashboards will be applied to the emailed data. If deselected, the data will export with whatever default filters are applied. Default filters are filters that are applied by dashboard Admins when editing the dashboard, and they are automatically applied for all dashboard users.
If you want to test the email, click Send me a test email. This will only send the email to the address associated with your account. Then, click Send Email or Schedule Email.
Unit leaders have access to a Qualtrics dashboard with survey results for their unit. A Unit Leader is defined as a Dean, Chair, Area or Program Director, or equivalent administrative role, who has supervisory responsibility for instructors.